Mercer Benefits Dashboard
A dashboard to help organizations monitor and analyze pension plans.
Overview
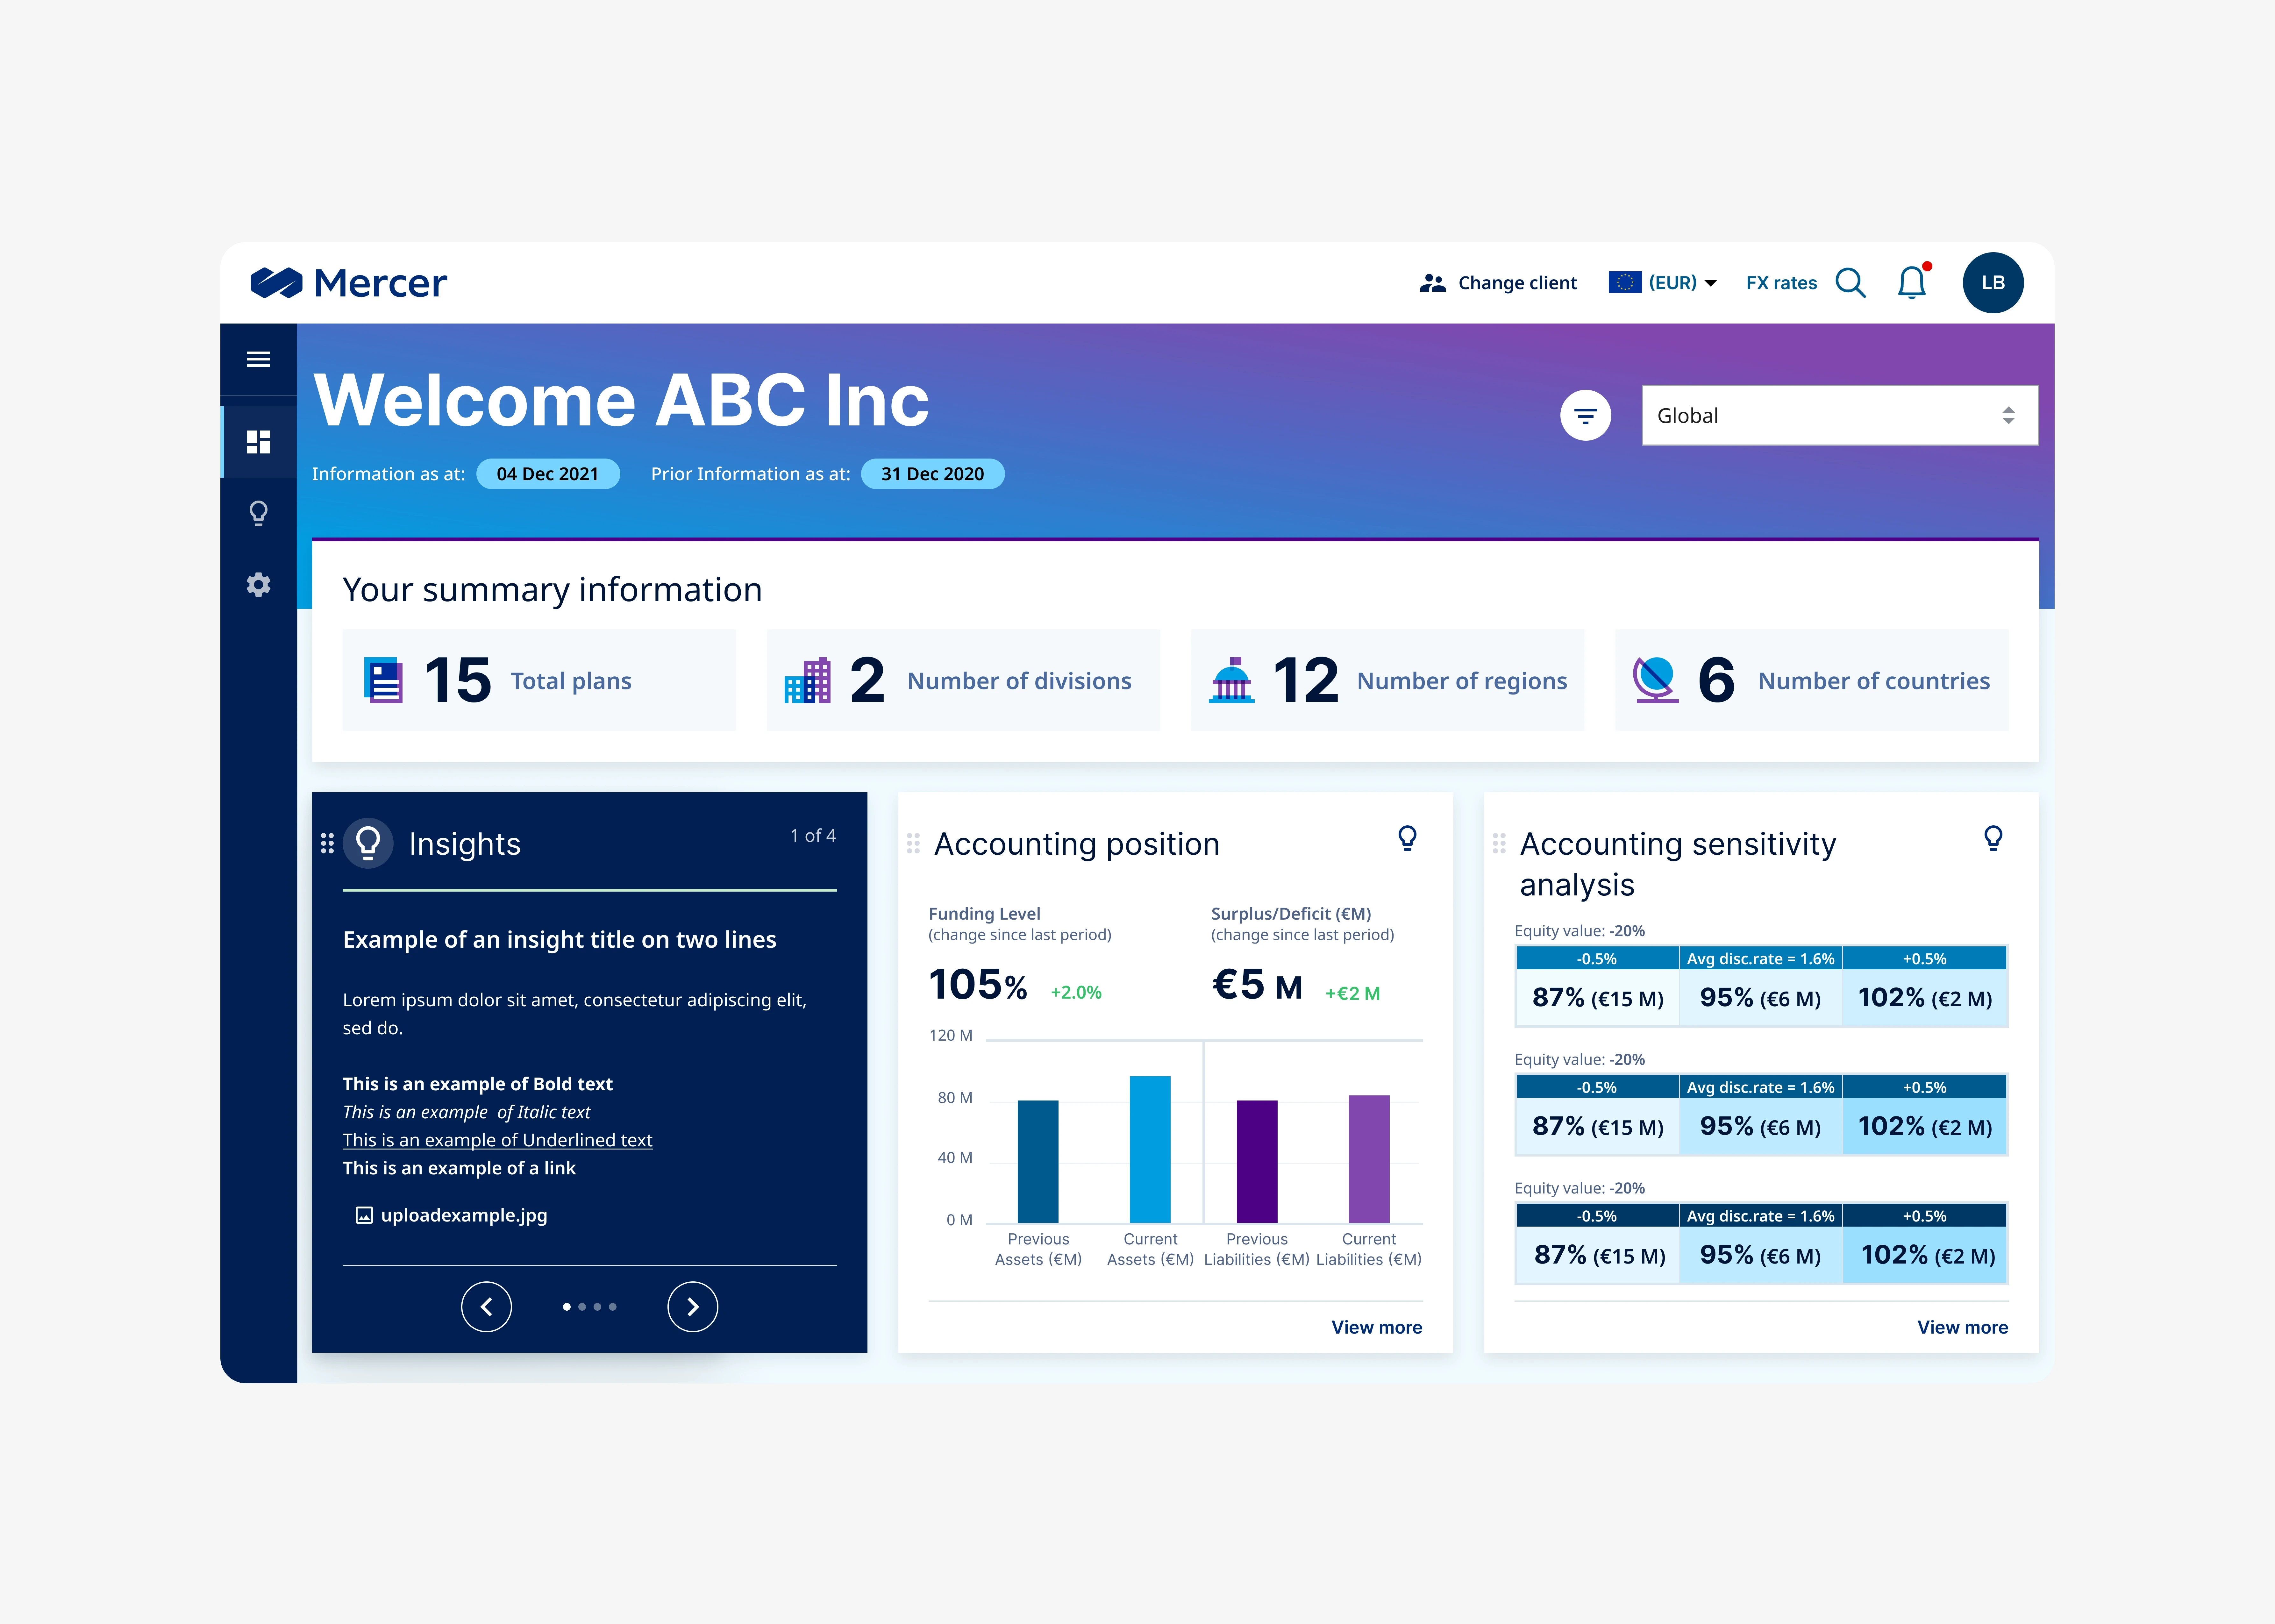
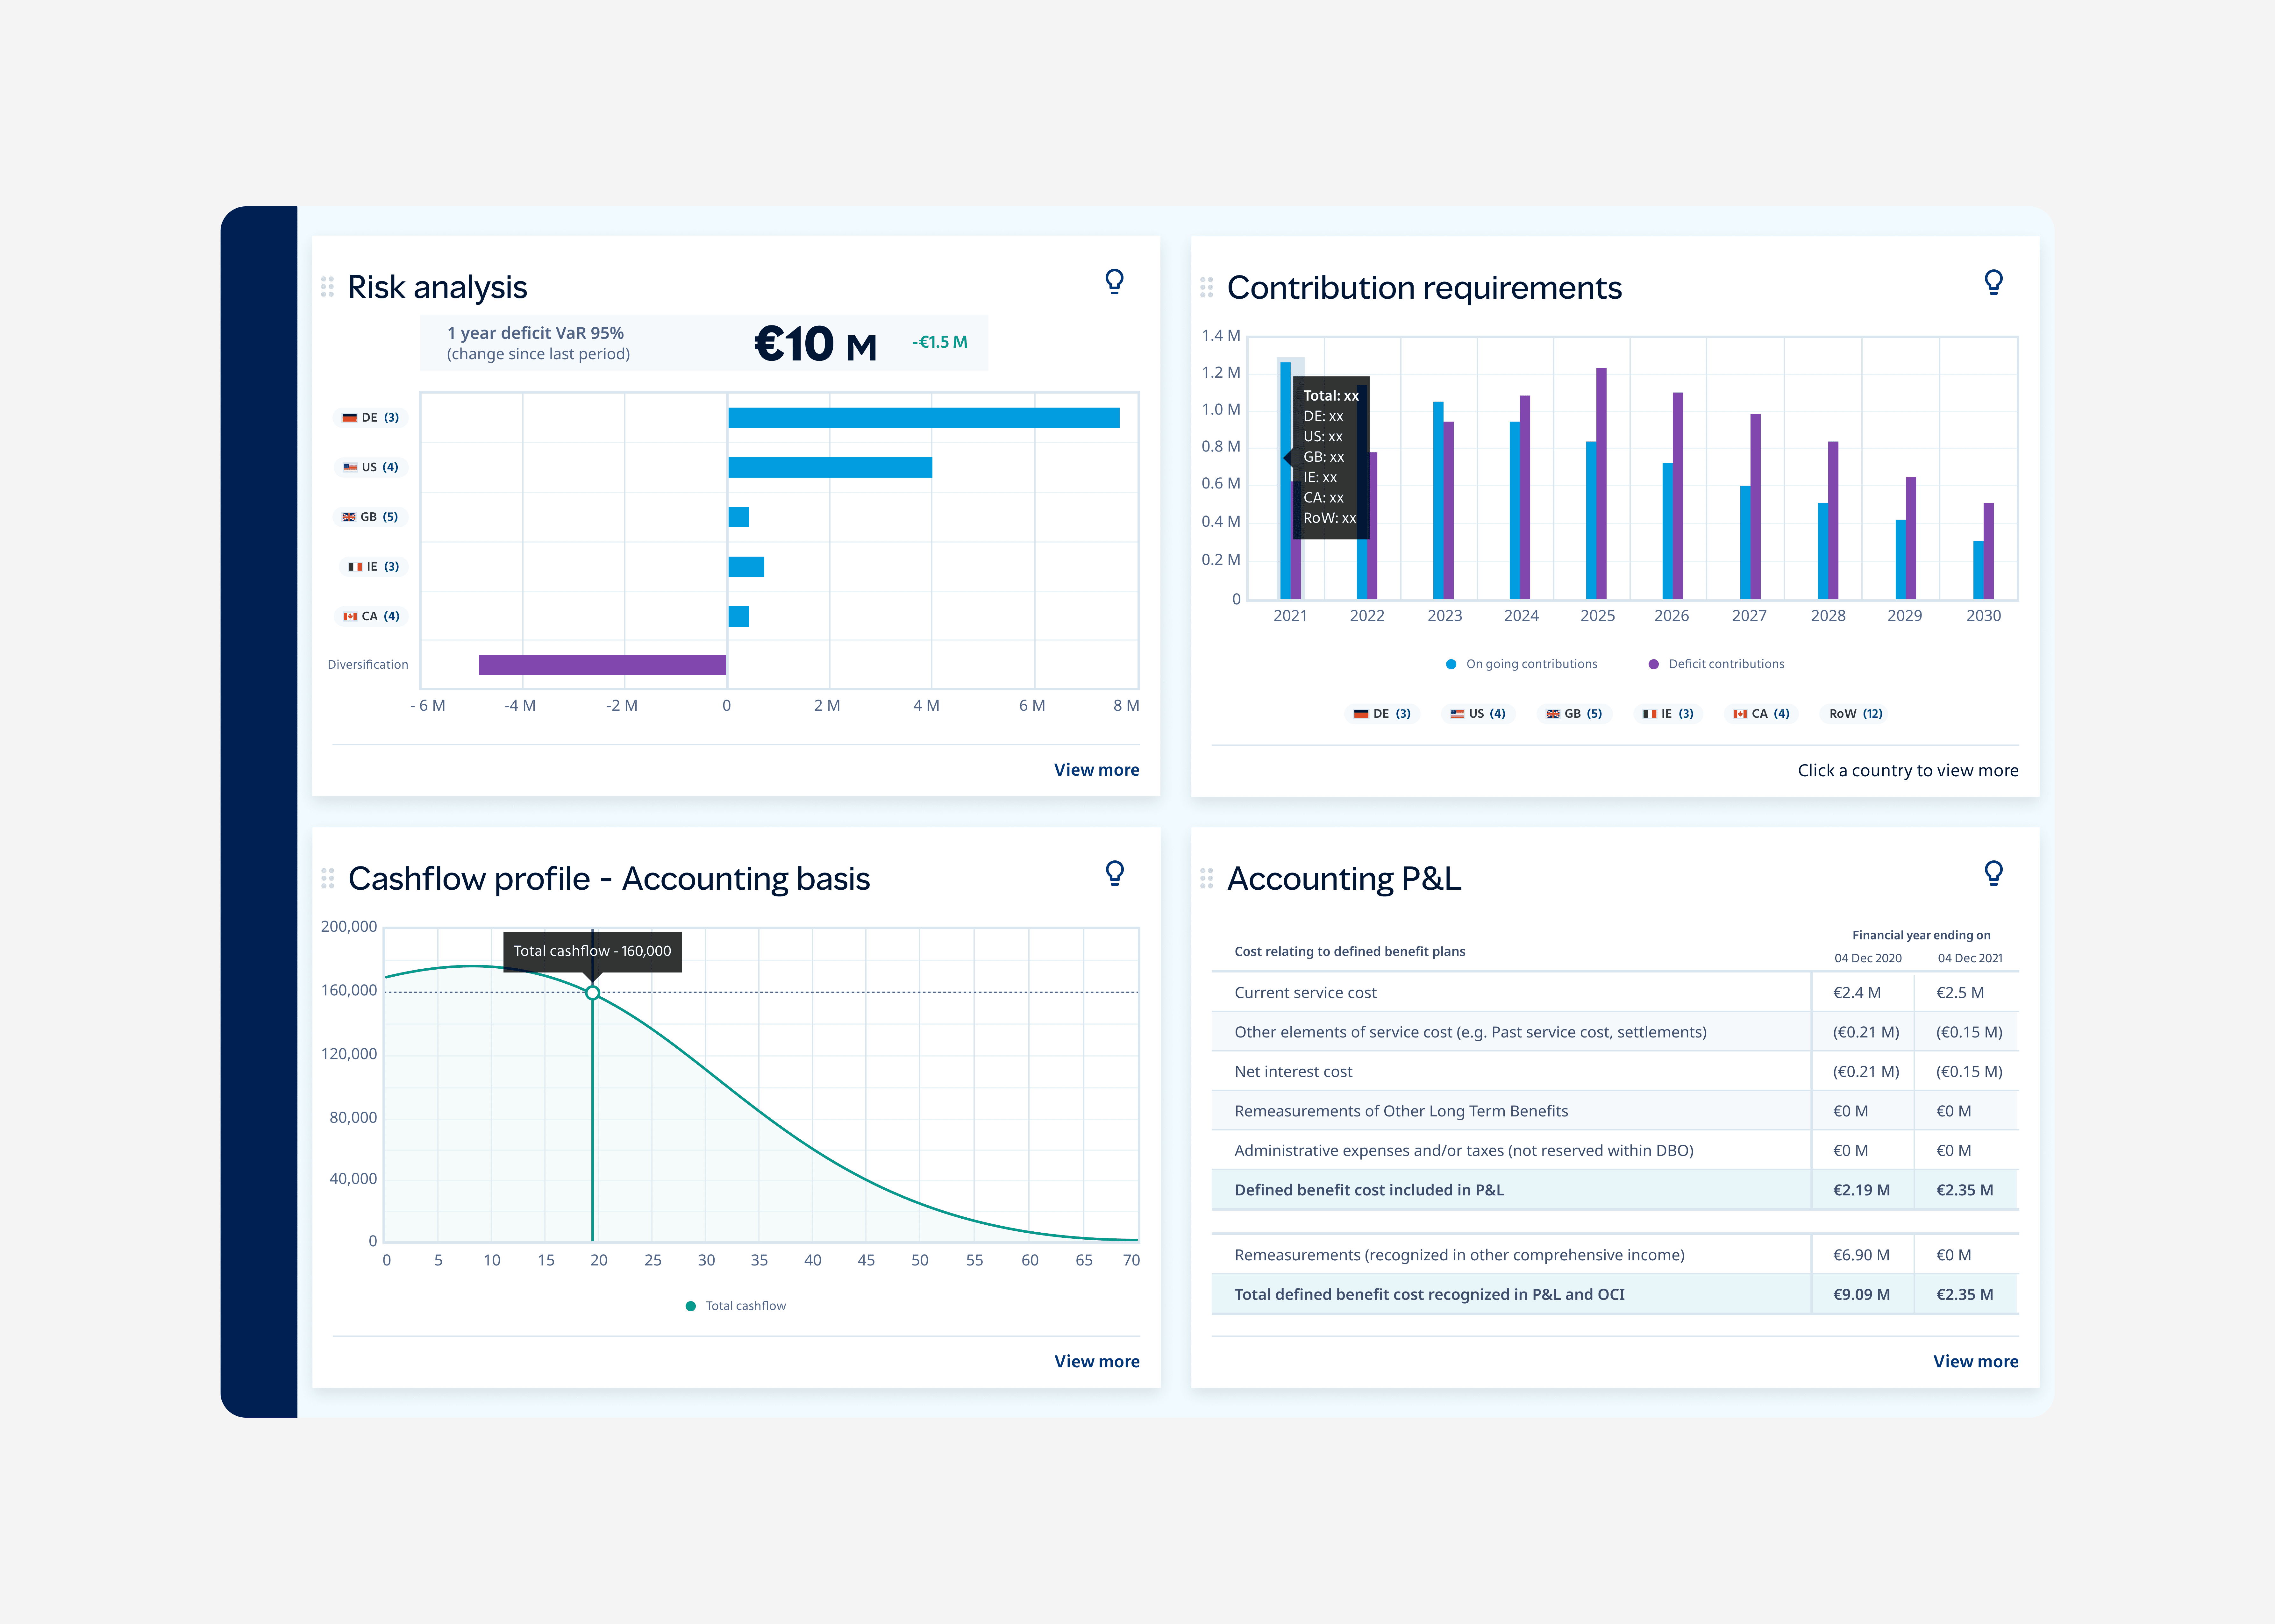
Mercer Benefits Dashboard is a responsive web dashboard that helps organizations monitor and analyze their defined benefit (DB) pension plans in a clear, customizable way. The goal was to turn complex actuarial and financial data into an at‑a‑glance experience that plan sponsors, trustees, and stakeholders could actually use to make decisions.
Project Details
Design Role: Lead Product Designer
Tools Used: Figma, Figjam
Client: Mercer
The Challenge
Mercer works with organizations that manage large, complex pension plans, often across multiple regions and currencies. These plans generate dense, technical data that is difficult for non‑specialists to interpret.
The Solution
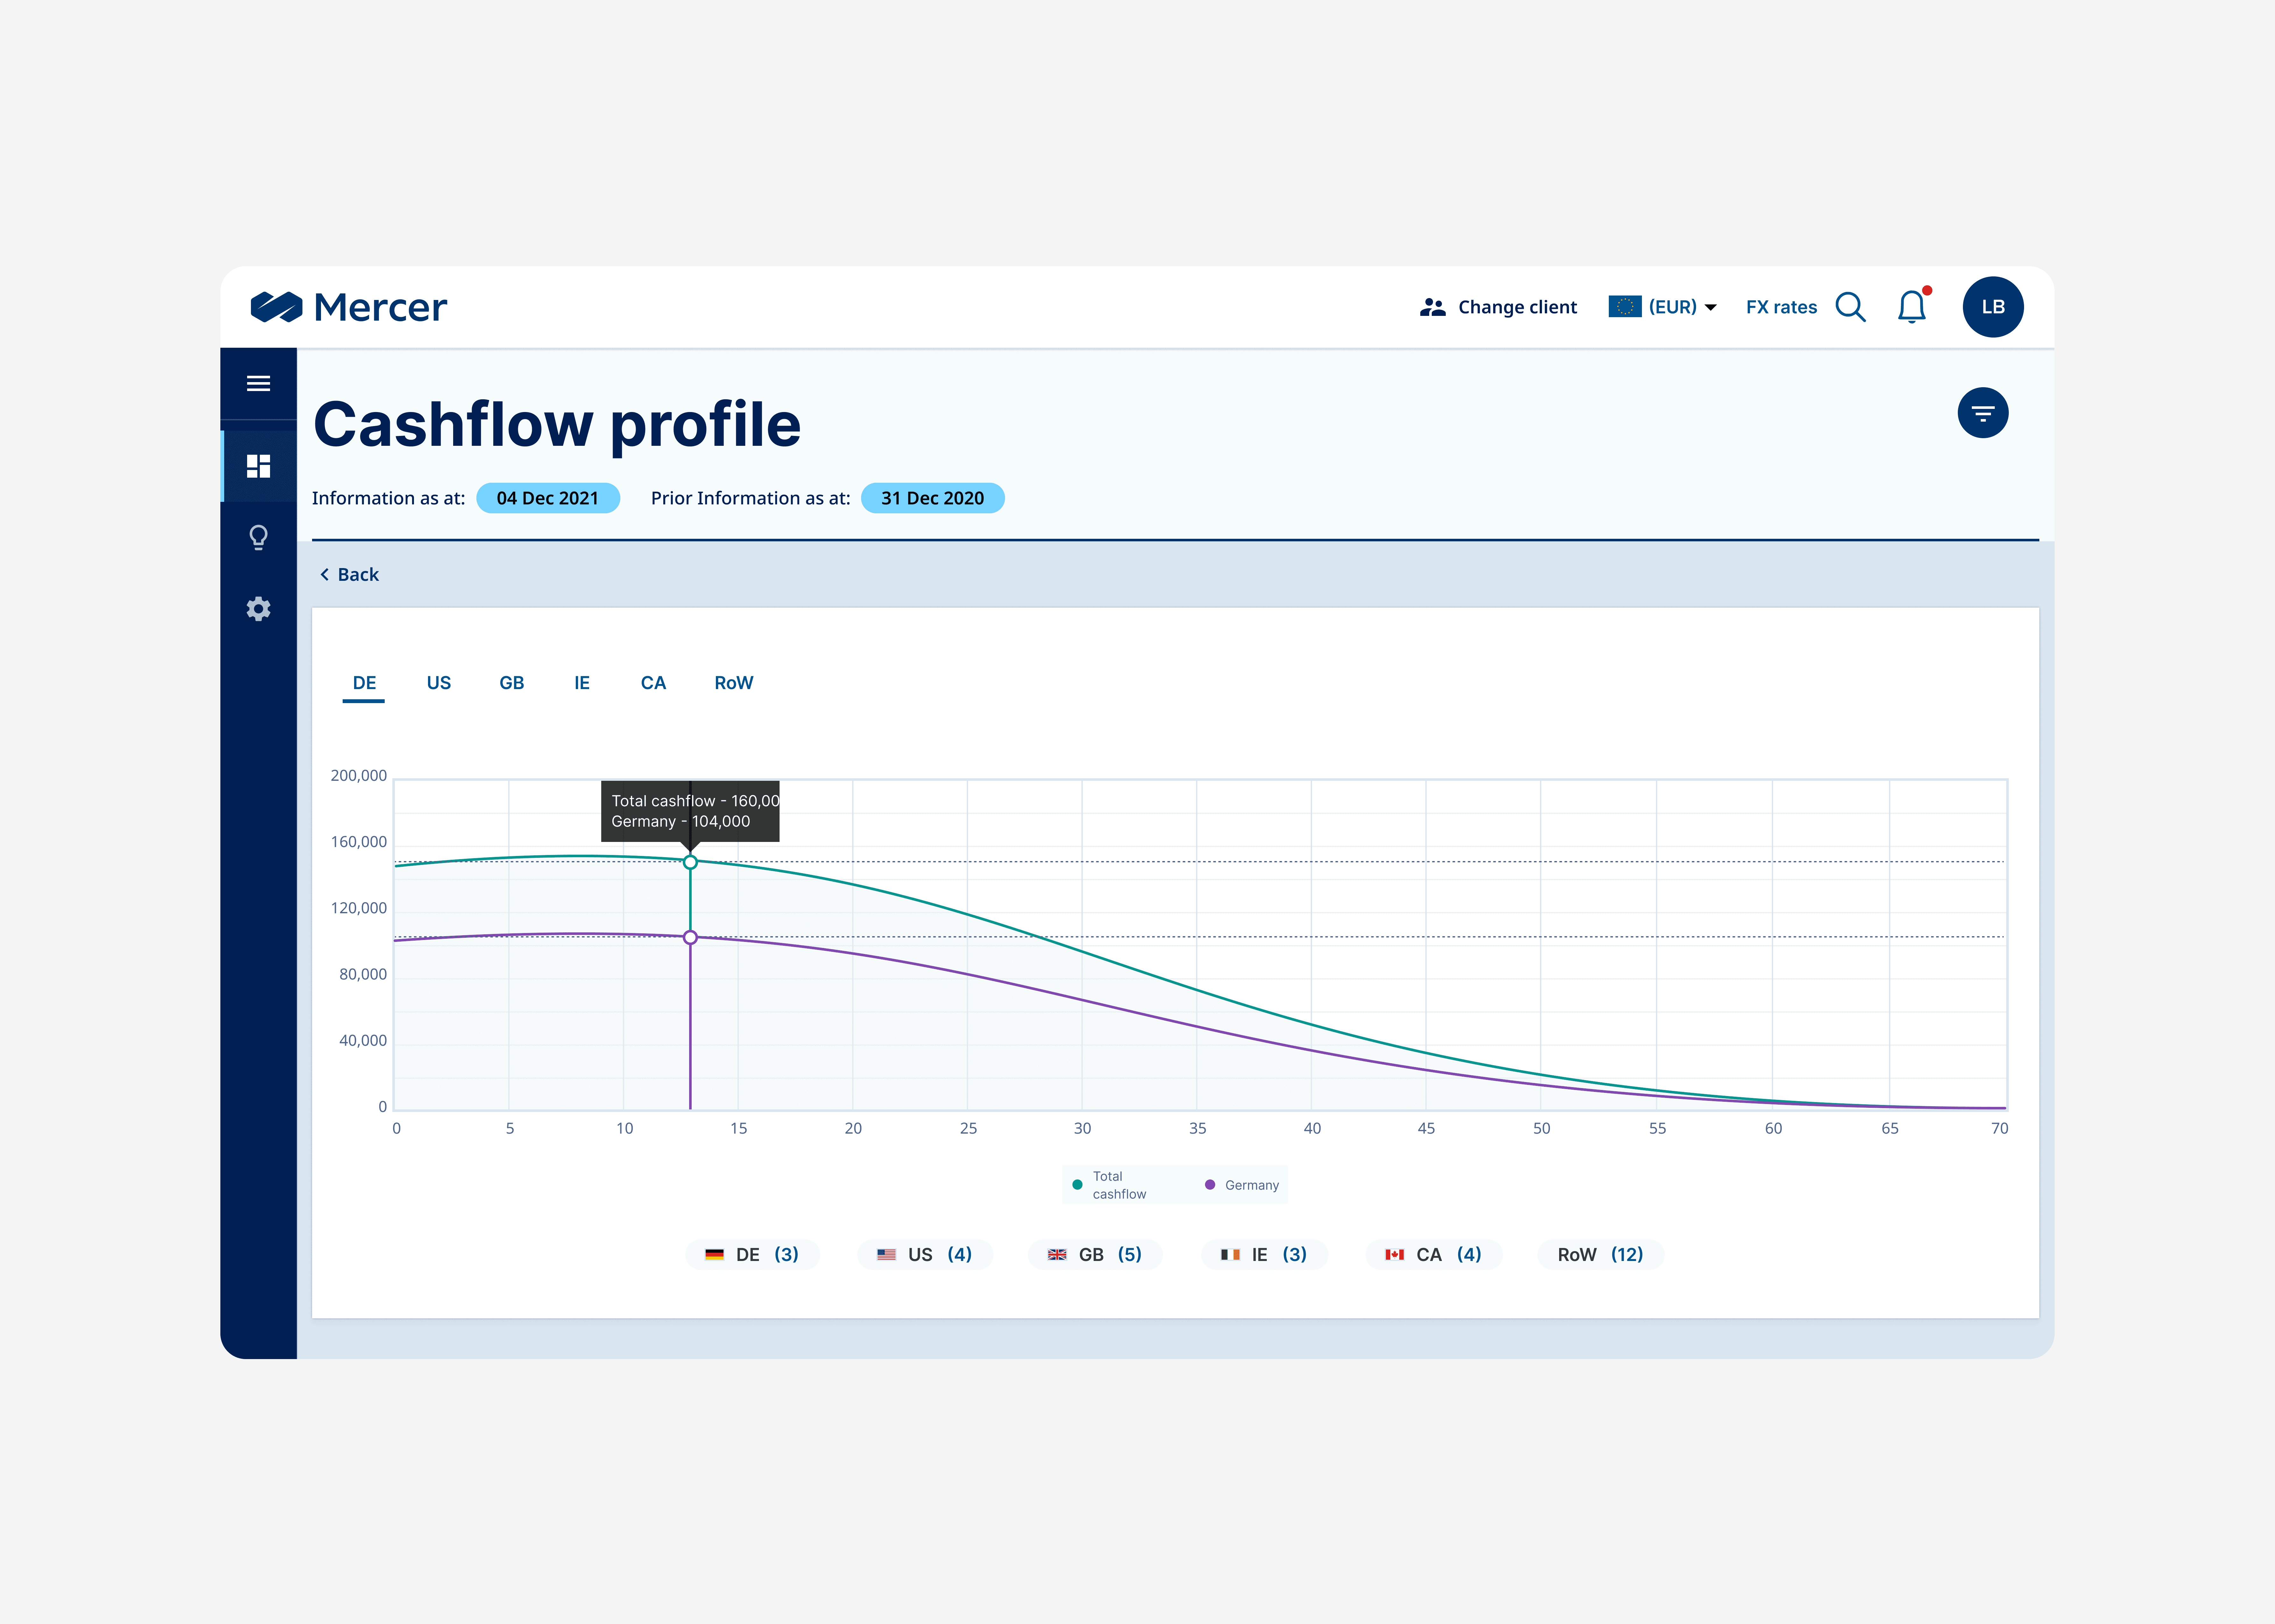
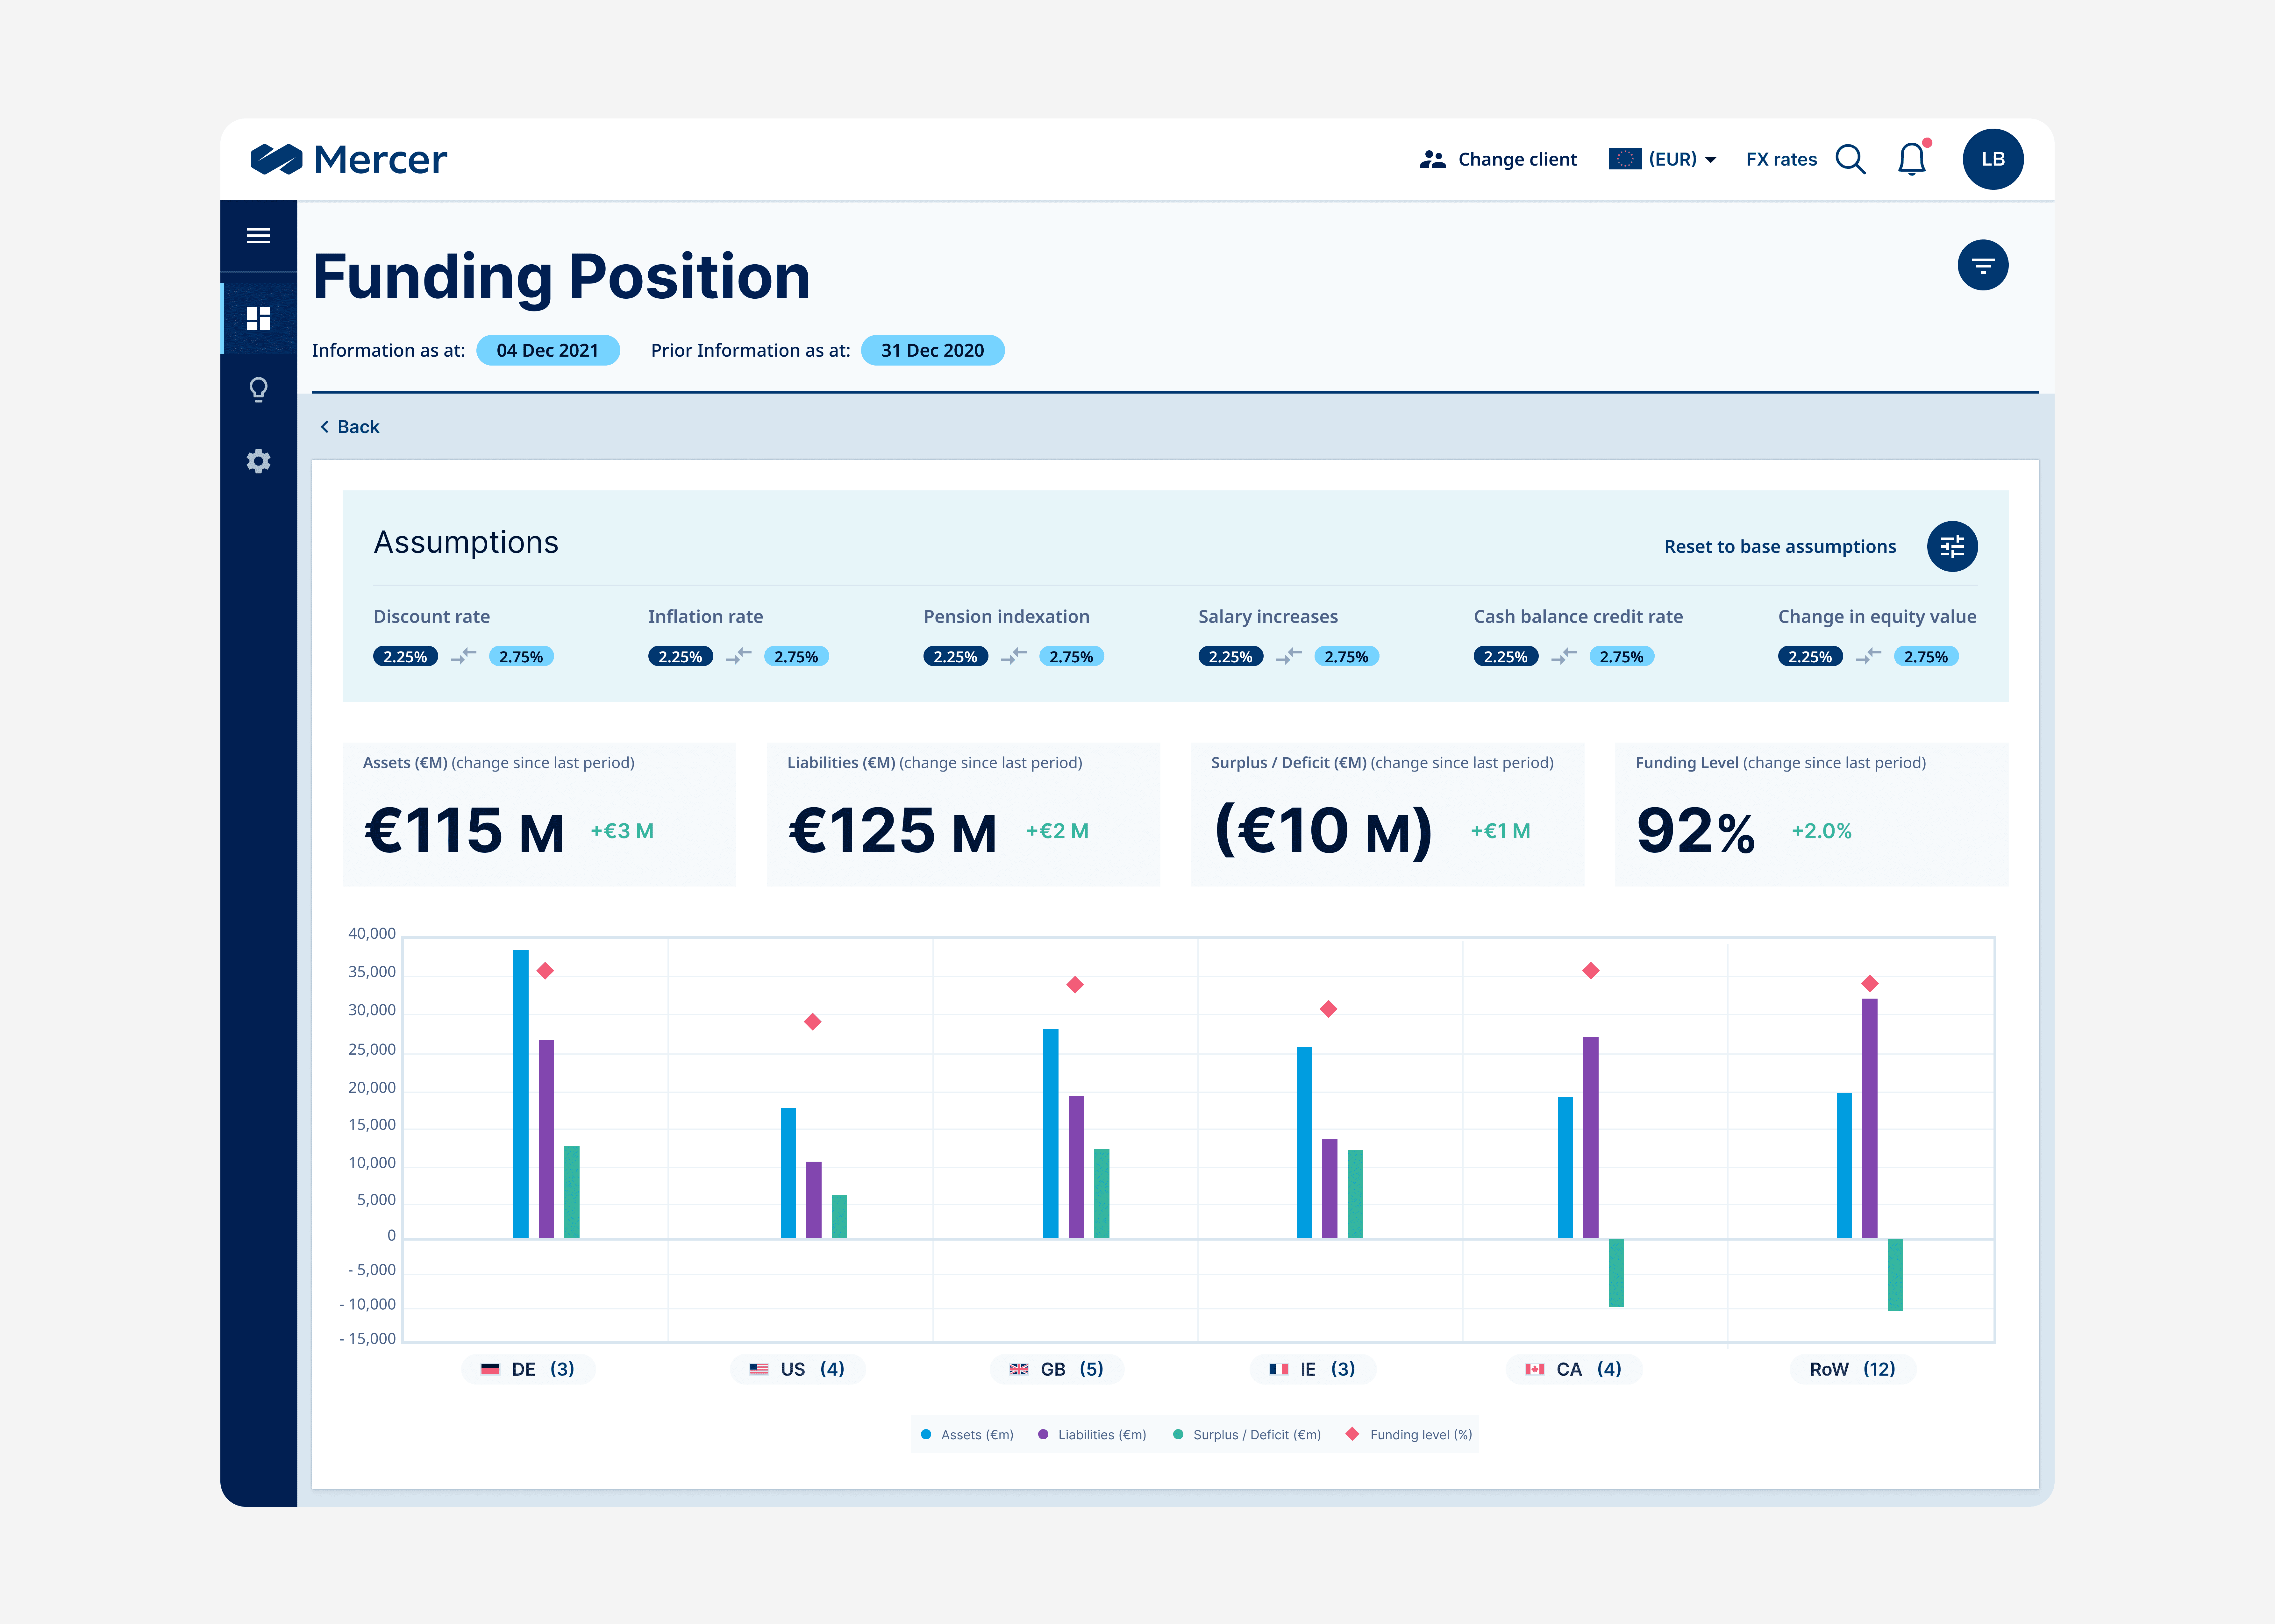
The final solution was a customizable, responsive dashboard that gives users a single, user-friendly overview of key plan statistics.
Research & Discovery
Tools Used: Provisional Personas
Provisional Personas
I developed three provisional personas informed by Mercer’s target market and insights gathered from initial secondary research. These personas served to define key user segments, guide the selection of appropriate interview participants, and inform the structure and framing of the interview questions.

Subject Matter Expert
I spoke with Subject Matter Experts at Mercer to better understand the landscape.
User Interviews
I was connected with mercer clients to conduct user interviews. To guide me when conducting user interviews, I put together a list of questions that aided me when conducting user interviews. I used the research plan and provisional personas when drafting these questions.
Synthesis & Defining
Tools Used: Empathy Map
Uncovering Insights & Identifying Needs
After my user interviews were completed In order to extract insights and needs from my user interviews, I created an empathy map. I categorized each users statements into the following segments: Thinking & Feeling, Doing, Seeing & Hearing and Say. From the organized empathy map I extracted user insights and user needs. I looked for patterns, themes, similarities, and contrasts. Doing so helped me uncover insights from my observations and move towards identifying implicit user needs.

Primary User Persona
Based on the information from my clustered empathy map and my general research, I created a provisional persona of an ideal Mercer user. Creating a single persona of a potential target customer is important because it allowed me to identify a point of views from which the user might engage with the services and imagine how might we’s that would create soulutions for their unmet needs.

Defining the Design Problem
Based on the information from my clustered empathy map and my general research, I created a provisional persona of an ideal Mercer user. Creating a single persona of a potential target customer is important because it allowed me to identify a point of views from which the user might engage with the services and imagine how might we’s that would create soulutions for their unmet needs.

How might we help Mercer plan sponsors analyze pension plan data in a digestible way, while supporting scenario planning and ongoing monitoring?
Brainstorming + Ideation
Based on the information from my clustered empathy map and my general research, I created a provisional persona of an ideal Mercer user. Creating a single persona of a potential target customer is important because it allowed me to identify a point of views from which the user might engage with the services and imagine how might we’s that would create soulutions for their unmet needs.
Project Strategy
Tools Used: Empathy Map
Comparing Business and User Goals
I compared and contrasted my initial business goals with the goals of the user in order to analyze any commonality between them.

Product Roadmap
Then I created a product roadmap to outline goals, features and metrics for the dashboard. I used my POV, HOW, business and user goals and the ideas that i brainstormed when establishing features.

Site Map
I created a site map for to show the dashboard structure and features that I planned to design. I began by referencing my product roadmap as a guide to inform how the new functionality might operate in the current app experience.

Interaction Design
Tools Used: Empathy Map
UI Requirements
I identified feature requirements for key pages to assist me in the creation of my high fidelity prototype. I developed a list of user interface requirements by reviewing the sitemap and product roadmap.
User Flow
I created a user flow to showcase the users journey through each expected scenario. Using my site map as a base, I thought through each task that the user would need to take in order to successfully complete the task and outlined it visually to ensure it made sense overall.
Task Flow
I created a task flow to show how a user would complete a task on the app. I created my task flow from my user flow adding in more steps and showing potential user decisions.
Wireframing
To start thinking about how the content will be arranged on key pages I created low fidelity wireframe sketches. I started by referencing my UI requirements doc and looked at competitor apps for inspiration.
Mid-Fidelity Prototype
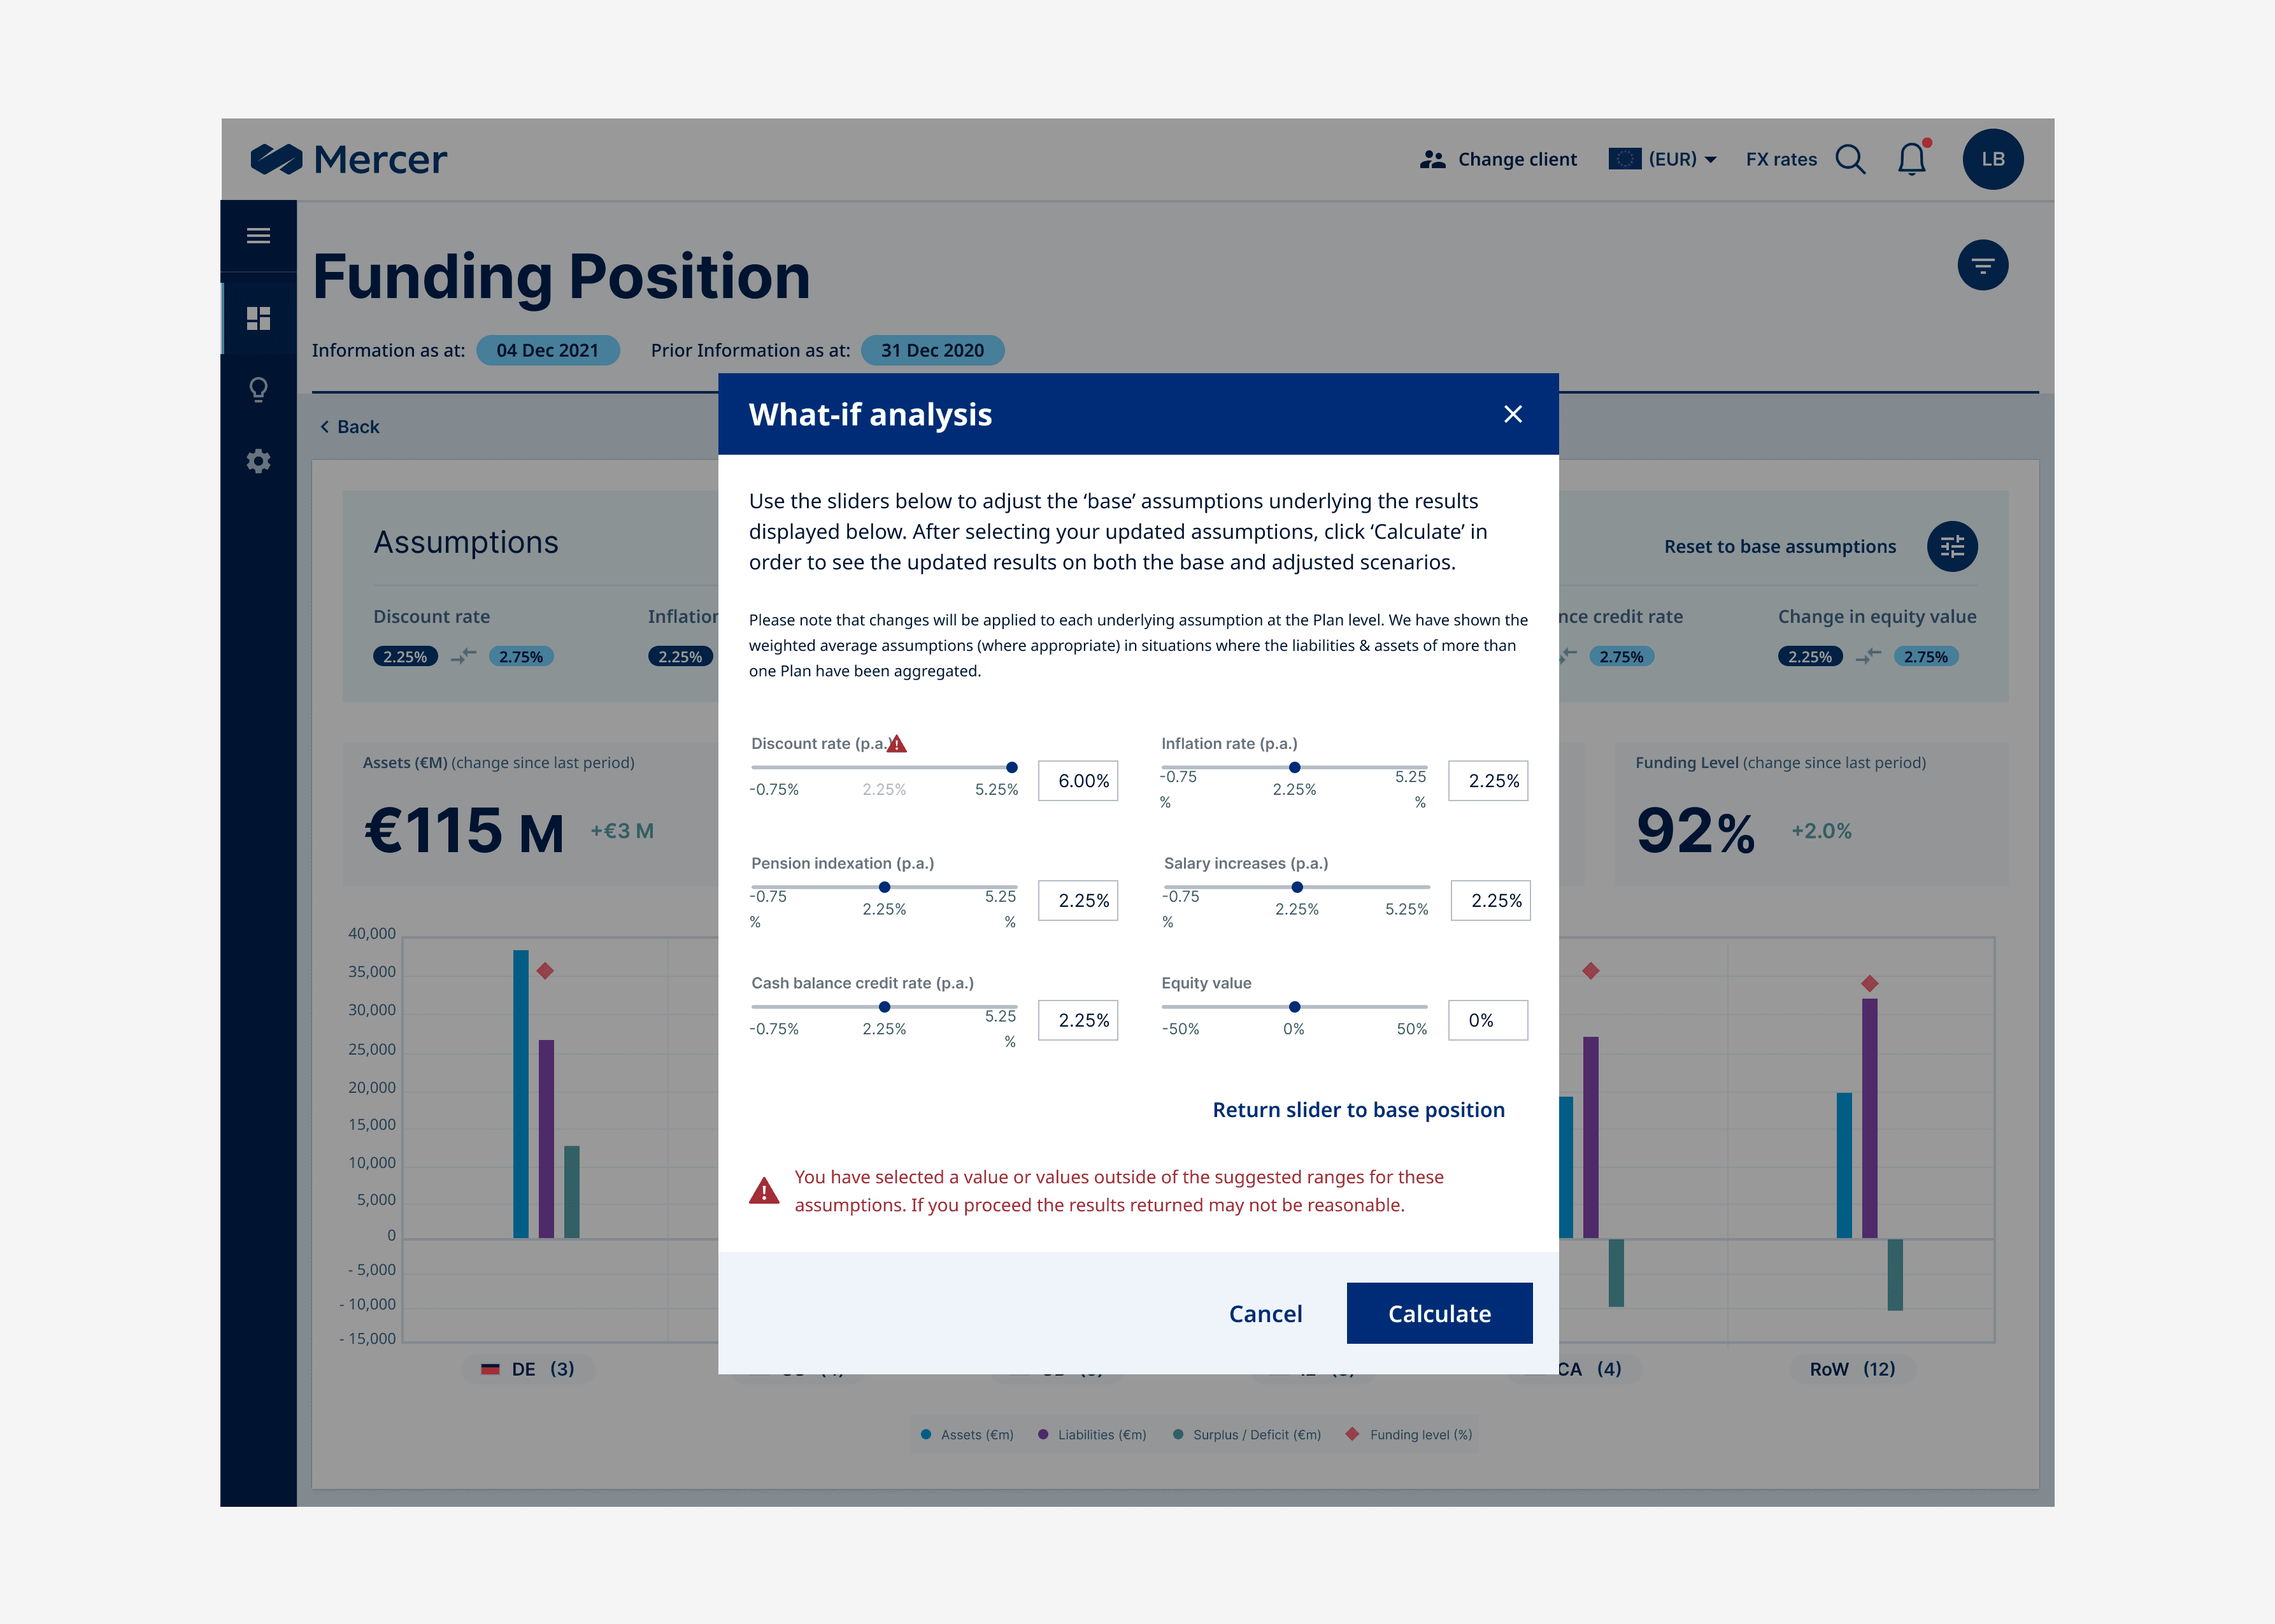
To show how the visual design will look I created mid fidelity wireframes of key screens. I then brought these screens to make a clickable prototype.
Usability Testing
Tools Used: Empathy Map
To test the usability design with participants I created a prototype of mid fidelity wireframes. I imported my screens into Figma and created a clickable prototype.
Usability Testing
I created a usability test plan to define the test objectives for my usability test. I tested the dashboard with participants and documented their experience interacting with the prototype. Then I compiled notes from each session and created a summary of all of the tests findings.
Affinity Map
I created an affinity map to extract insights and design recommendations. I used my usability test notes and arranged these into clusters. I grouped these clusters into successes, patterns and comments. From this I gathered insights then made design recommendations.

UI Design
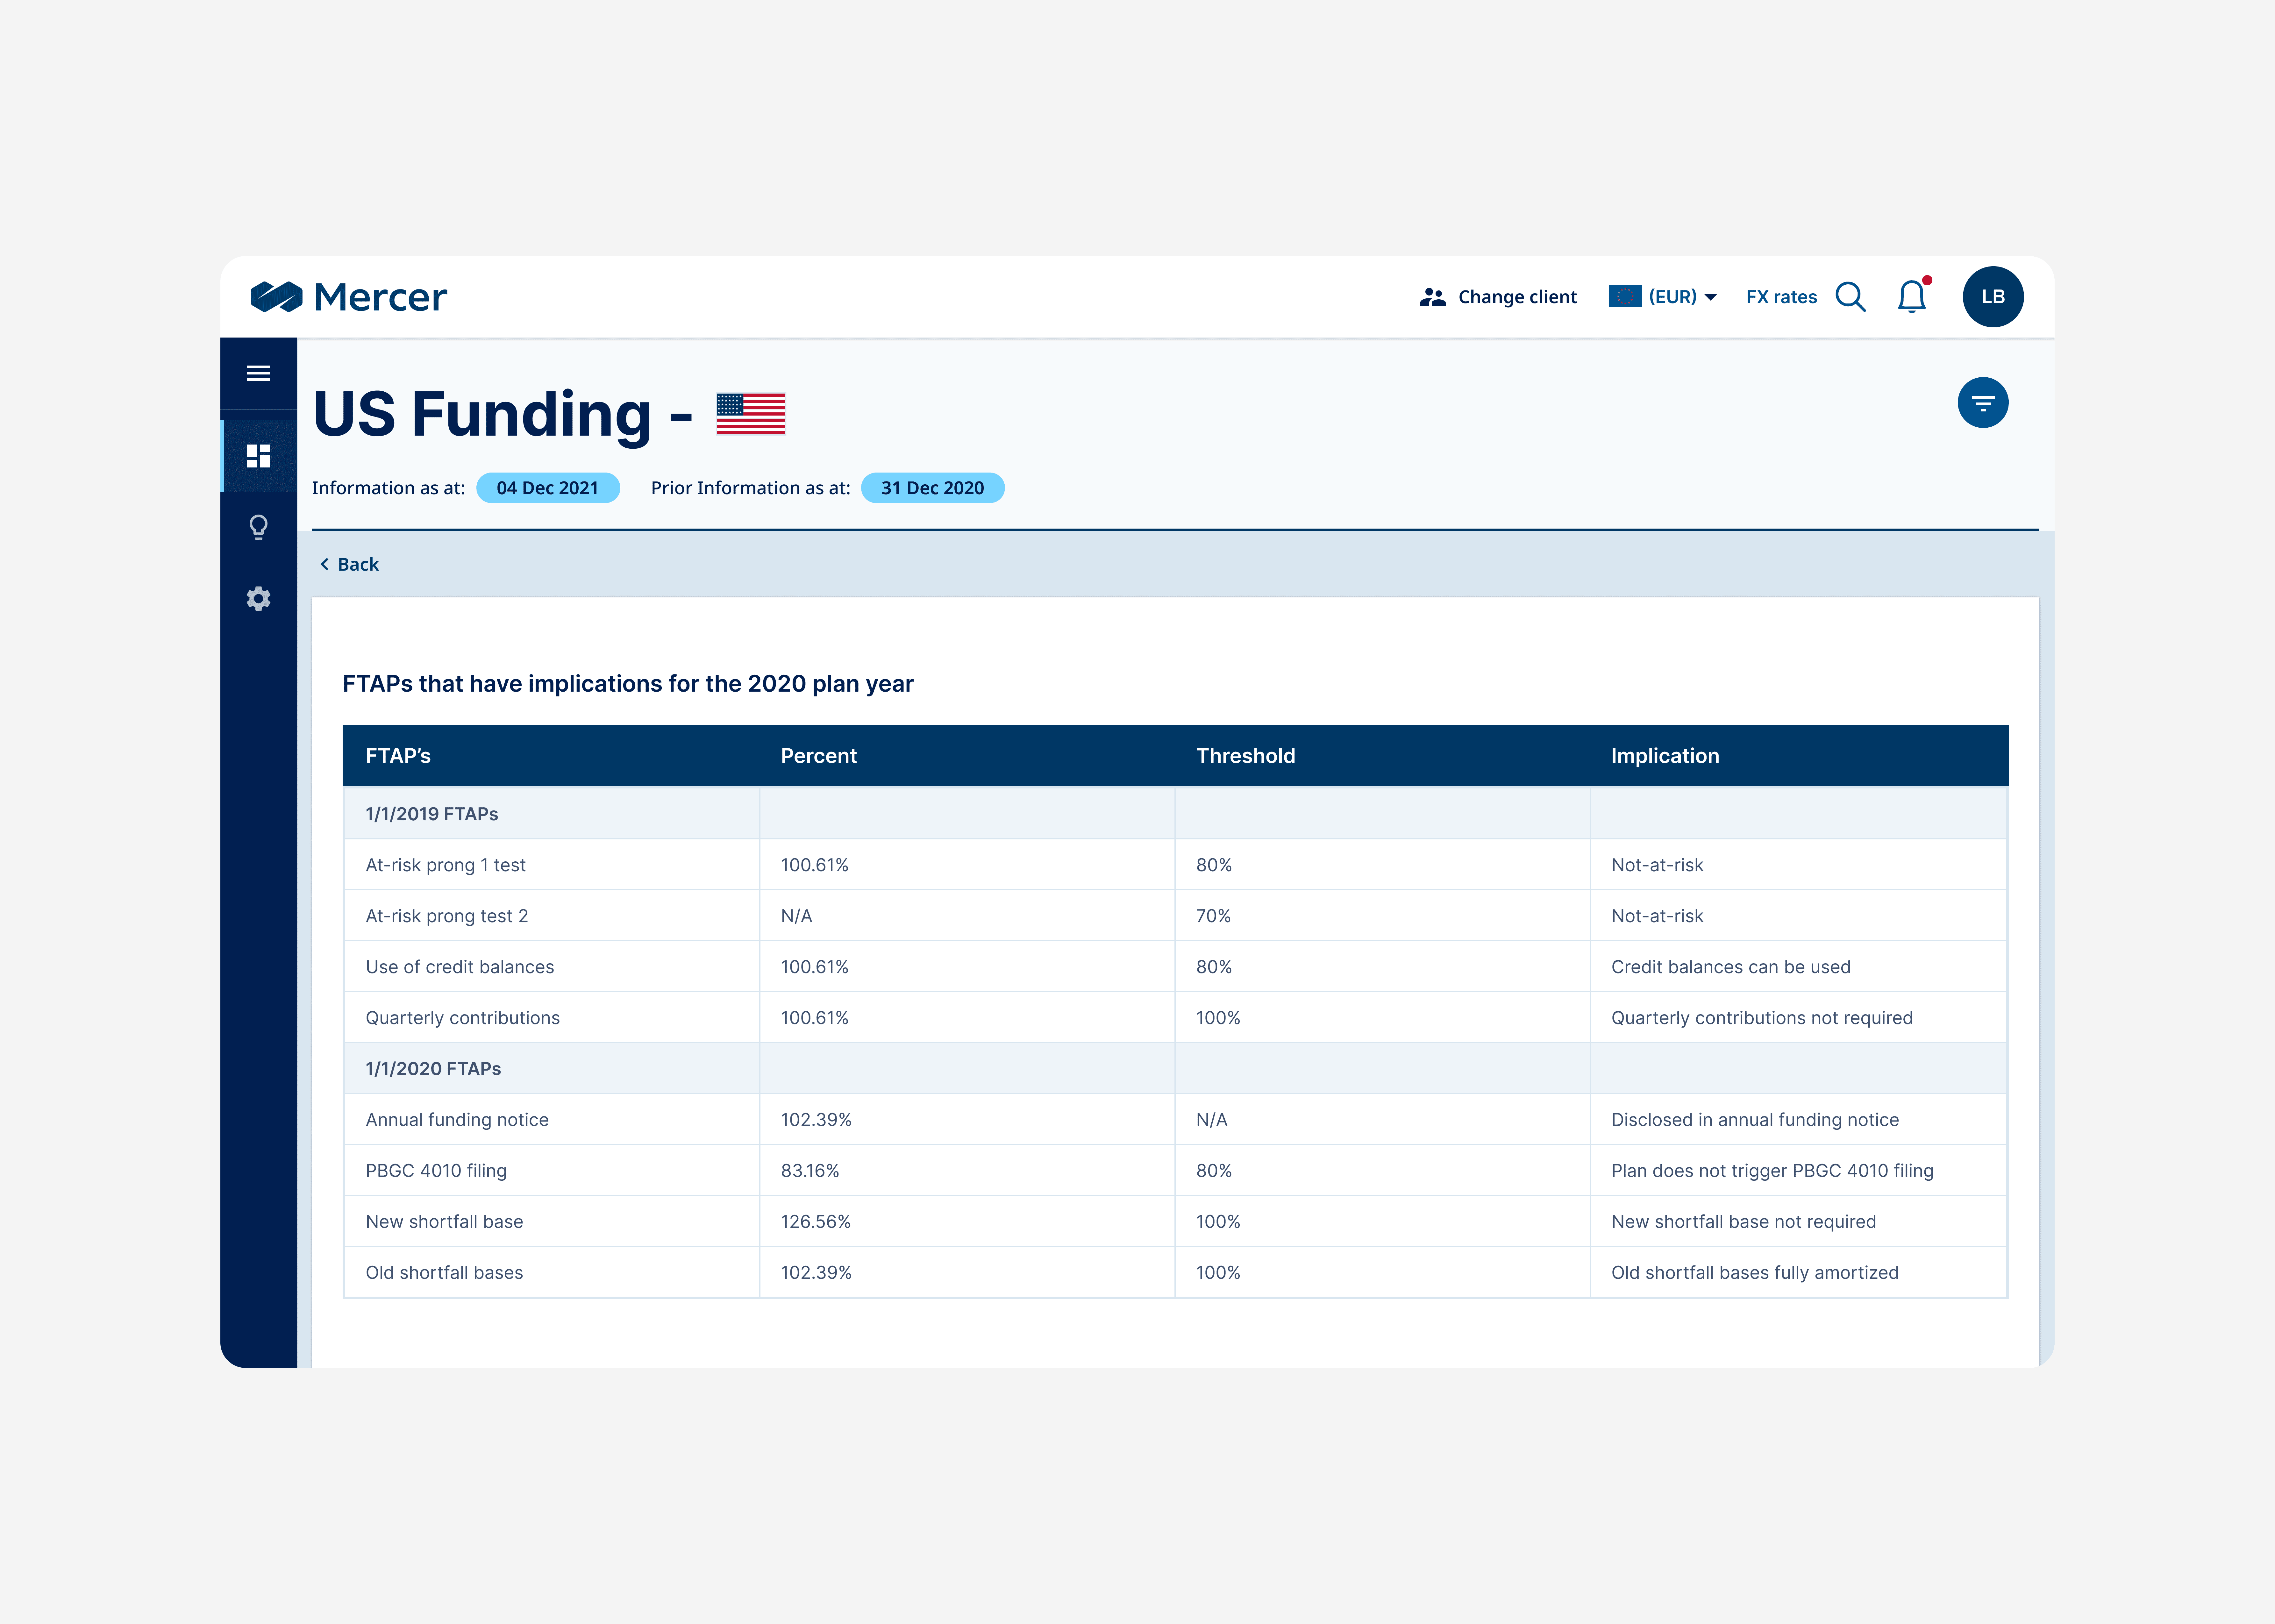
High-Fidelity Prototype
Based on the information from my clustered empathy map and my general research, I created a provisional persona of an ideal Mercer user.
Visual Direction
I referenced Mercers existing brand guidelines and created a style guide.
Next Steps
Based on the information from my clustered empathy map and my general research, I created a provisional persona of an ideal Mercer user.